Admin Sync Management
Exigo Admin
OVERVIEW
Sync destination performance is crucial to your business. Microsoft provides a full suite of SQL server
monitoring features built directly into Exigo Sync that are accessible directly within Exigo Admin.
These features will allow you to get key performance analytics from your sync destinations and will give
you the information you need to finely tune each SQL instance.
Driven by industry standards, Exigo Sync Monitoring will collect data points that matter most, some of the
included features are listed below.
- Query Performance
o
Most expensive queries
o
Wait statistics
o
Execution plan insights
-
Active Workloads
-
Database growth (data and log files)
-
Resource utilization
-
Index Fragmentation
-
Availability Group Health
-
Backup metrics
SYNC DESTINATIONS
If you have opted out of creating a Shared BI Sync DB via Exigo when initiating your sandbox, you have
the option of using your own Server to create a Synced copy of your data.
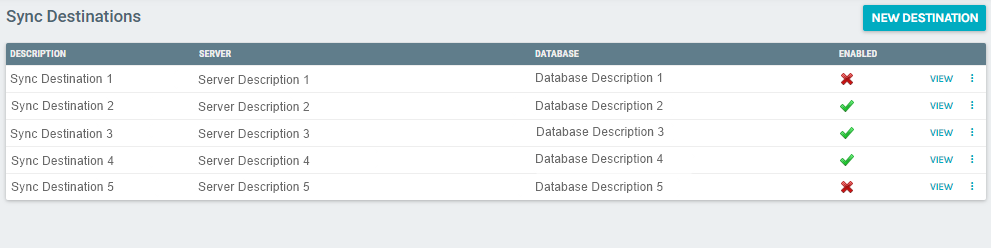
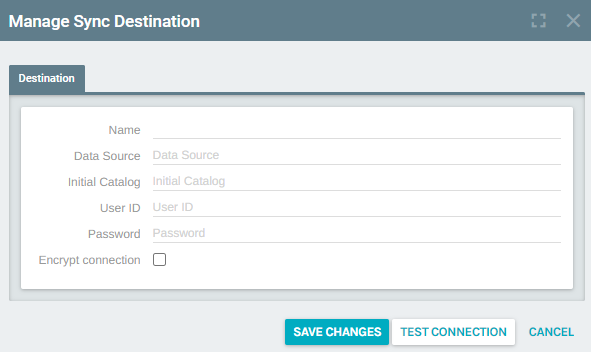
To add a Sync Connection, go to Company Portal > Sync Management > New Destination
From here, enter your credentials for the existing Server you want to sync your data to and click Save
Changes.


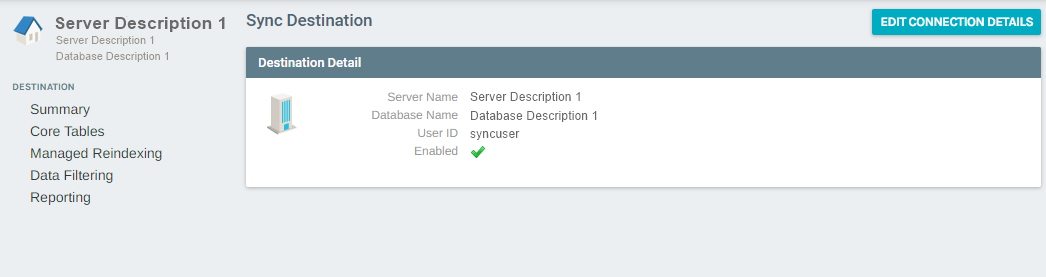
S UMMARY :
SUMMARY:
To see the summary of details for your Sync Destinations click on the desired option on the Sync
Management page.
From here you will be able to review the details of your Sync Destination and Edit the Connection Details
for the connection.
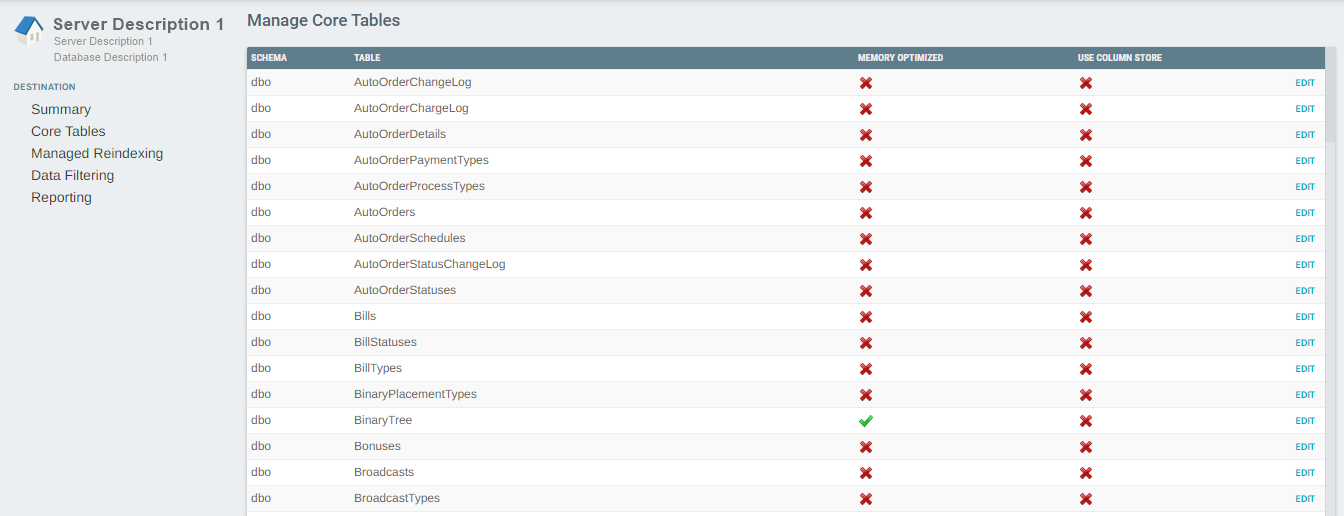
CORE TABLES:
To see a list of all of the Core Exigo DB tables and manage how they are indexed and stored in the DB you
can go to Company Portal > Sync Management > Select Sync Destination > Core Tables.
Memory Optimized
Setting tables to memory Optimized can help improve performance of tables. For more information about
memory optimized tables, please see the official Microsoft documentation located here.
Column Store
Applying a Column Store index can improve speeds drastically when it comes to Data Analytics. For more
information on Column Store indexes, please see the official Microsoft documentation located here.


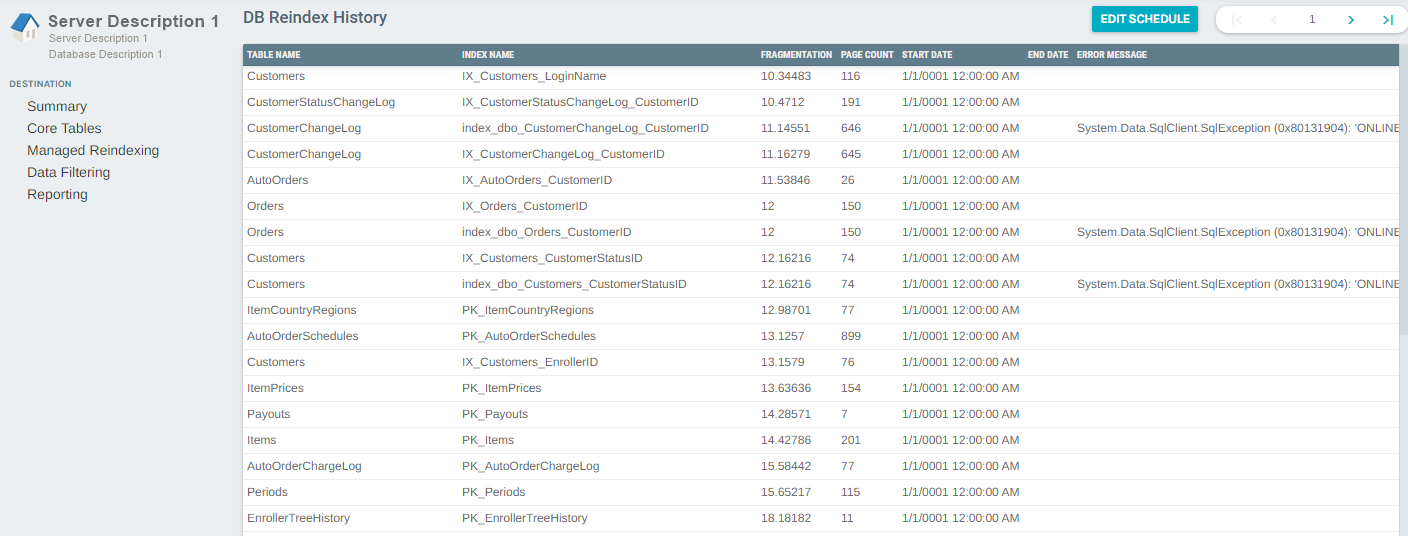
M ANAGED R EINDEXING :
MANAGED REINDEXING:
To manage your core Exigo DB table indexes navigate to Company Portal > Sync Management > Select
Sync Destination > Managed Reindexing.
From here you can control and configure if and when table indexes are rebuilt.
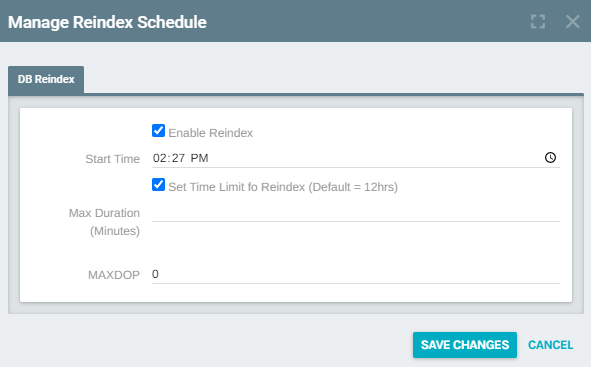
Edit Schedule
To edit/manage the Index rebuild schedule click on Edit Schedule in the top right.
From here you can enable/disable reindexing of table indexes and control how long a rebuild is to take.
-
Enable Reindex - Ability to enable and disable the automated process of rebuilding table indexes
-
Start Time - Here you can define the time you want the rebuilding of indexes to occur. Best
practice dictates you set these to be rebuilt during non-peak times for your business.
- Set Time Limit for Reindex (Default = 12hrs) - Allows you to control the max amount of time a
rebuild is allowed to take. When selected you are able to provide a max amount of time in the
following field.


D ATA F ILTERING :
- Max Duration (Minutes) -Allows you to define how long the process of rebuilding an index is
allowed to take. If no value is provided, it will by default allow a maximum of 12 hours.
- Max DOP -Max degree of parallelism (MAXDOP) is a setting in SQL Server that controls how
many processors may be used for parallel plan execution. Parallel plan execution is good'it lets
SQL Server make the best use of all those processors in modern servers. This setting allows you to
to define how many processors may be used in the rebuilding of your indexes.
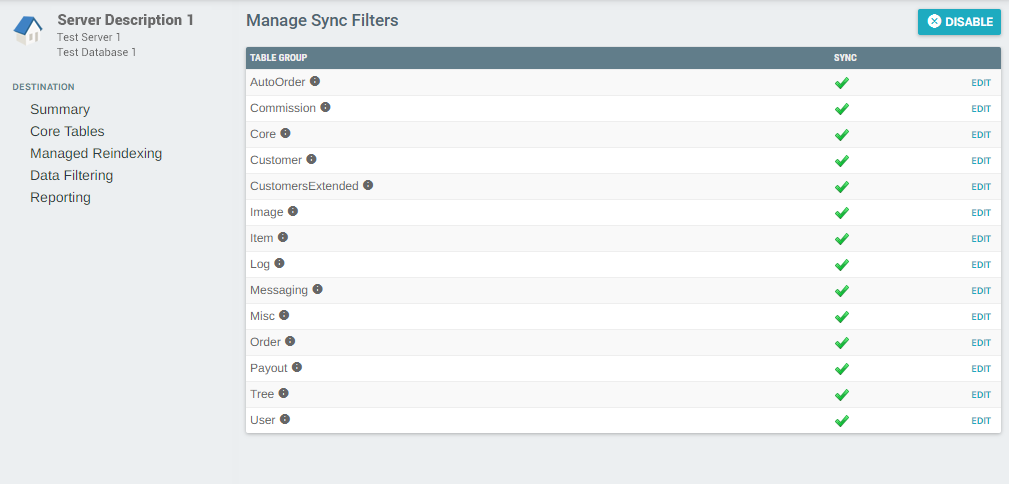
DATA FILTERING:
To manage which Exigo Core tables are included in Sync navigate to Company Portal > Sync Management
Select Sync Destination > Data Filtering.
From here you can select which core Exigo Table groups are included in Sync.
To see a list of included tables for each group you may hover over the tool tip located next to the Table
Group name.
To disable all tables from being included in Sync, you may use the Disable button located at the top right.
To disable individual tables you can click Edit to the right of a specific Table group, uncheck "Enable Group
Sync" and click Save Changes.

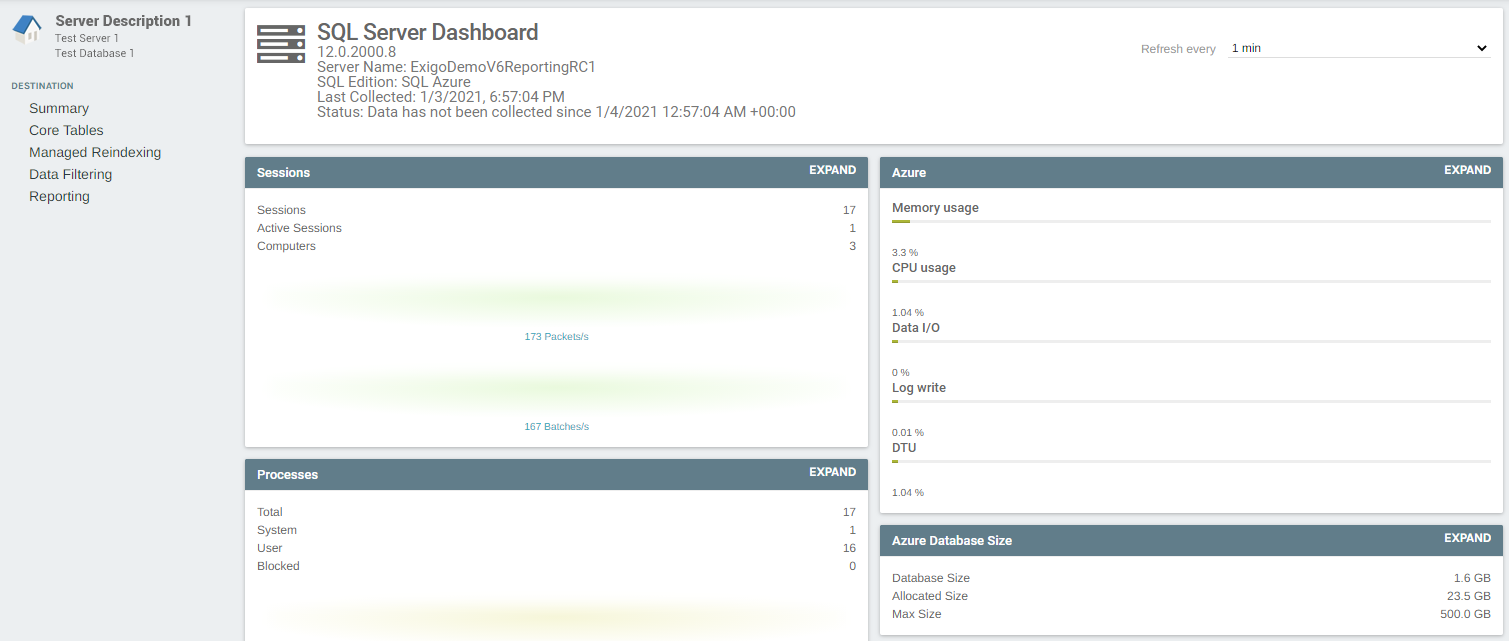
SQL DATABASE REPORTING DASHBOARD
REPORTING:
This section in the Sync Management menu serves up a robust set of comprehensive tools that allows a
user to review the health of their DB as well as various metrics pertaining to the activity taking place on
said DB. While more geared towards someone with a technical skillset such as a DBA or IT Team, this
section will be covered later in more detail.
Click here to jump ahead.
Below we will provide a high-level overview of each section on the dashboard and drill down into each of
them where possible.

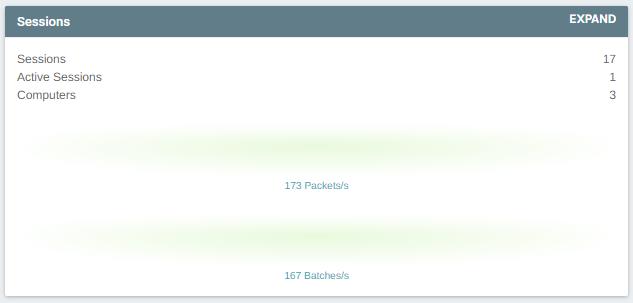
S ESSIONS :
SESSIONS:
This section provides a high level overview of session related data as well as packet and batch related
data.
Packets: This flow represents the rate at which network packets are being received by SQL Server from
client applications.
Batches: This flow shows the rate at which Batches of SQL statements are being submitted to SQL Server
from execution.
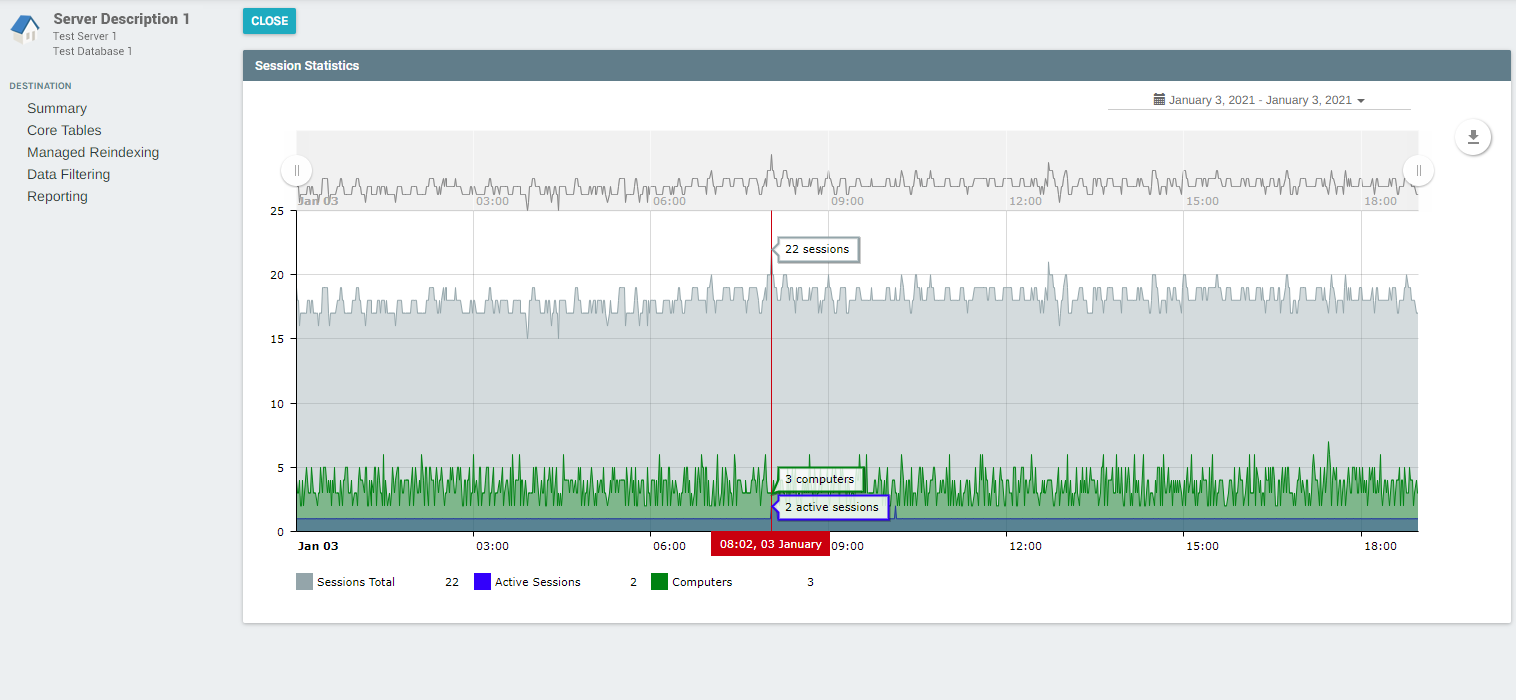
You can click "Expand" to drill down and see more information related the server sessions using an
interactive graph as shown below.
From here you can view and download session data.

P ROCESSES :
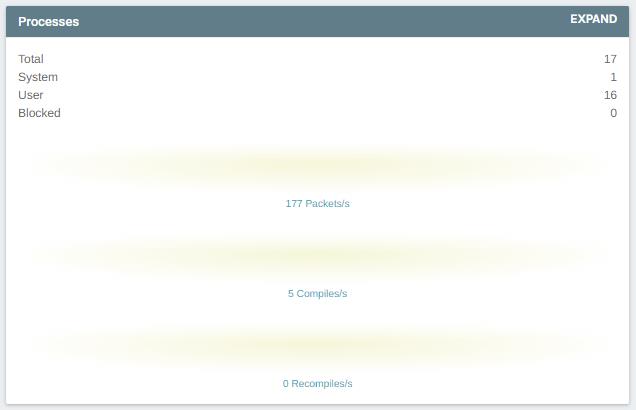
PROCESSES:
This section provides a high level overview of the processes being run against the Server as well as packet
and compilation overviews.
Packets: This flow represents the rate at which network packets are being sent from SQL Server to client
applications.
Compiles: This flow shows the rate of SQL compilations.
Recompiles: This flow shows the rate of SQL recompilations.
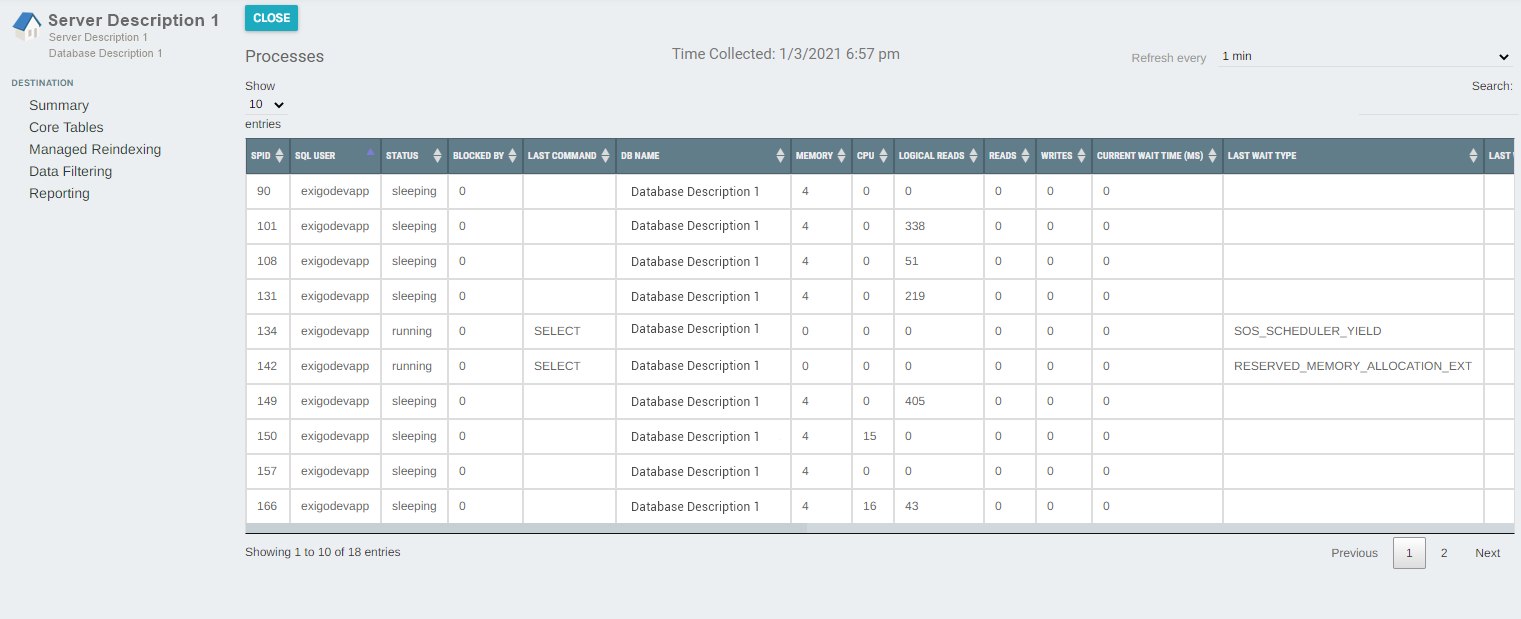
You can click "Expand" to drill down and see more information related the server processes using an
interactive Kendo Grid to sort and filter.
This section helps to provide a high level overview of the current SQL Server connections and their state.
In turn this provides DBAs with data needed to troubleshoot application timeouts, high CPU time, and
high disk IO.


W AIT S TATS :
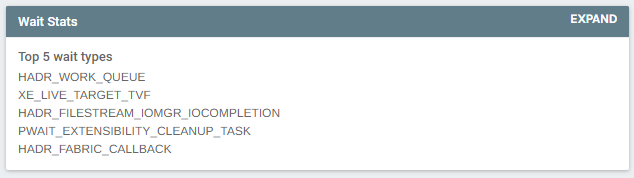
WAIT STATS:
Wait stats are captured and recorded by SQL Server and all this captured information is referred to as wait
statistics.
The promise of wait stats is to help quickly identify where the most pressing bottlenecks are building
within SQL Server. This data provides additional insight that can aid a DBA or technical resource in
resolving problems that are related to SQL Server performance.
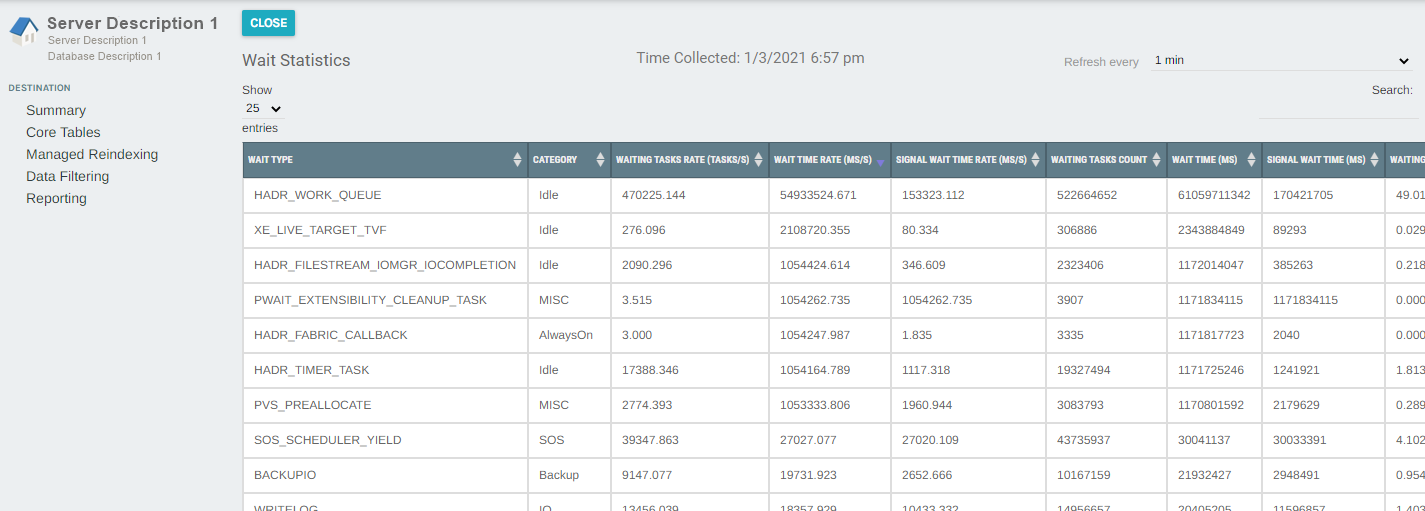
You can click "Expand" to drill down and see more information related the Wait statistics using an
interactive Kedo Grid to sort and filter data.


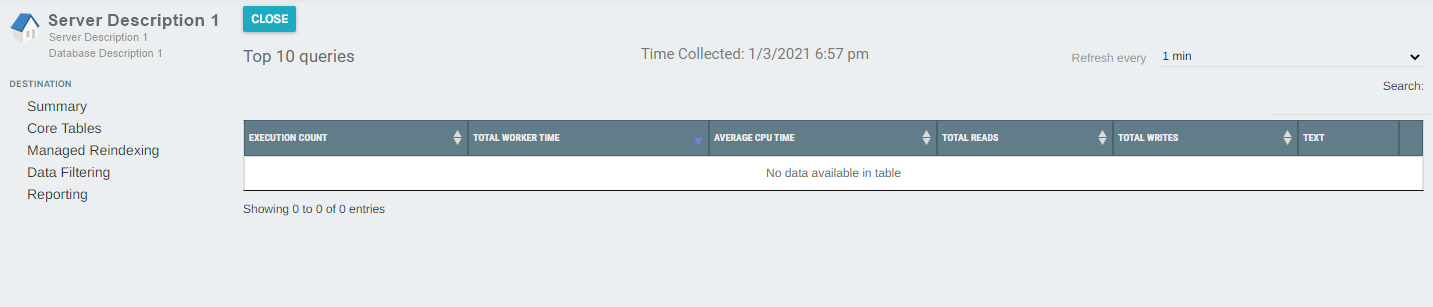
T OP 10 Q UERIES :
TOP 10QUERIES:
This section provides an overview of what queries are being run against your server.
You can click "Expand" to drill down further on the top 10 queries and their performace metrics using an
interactive Kedo Grid to sort and filter data.
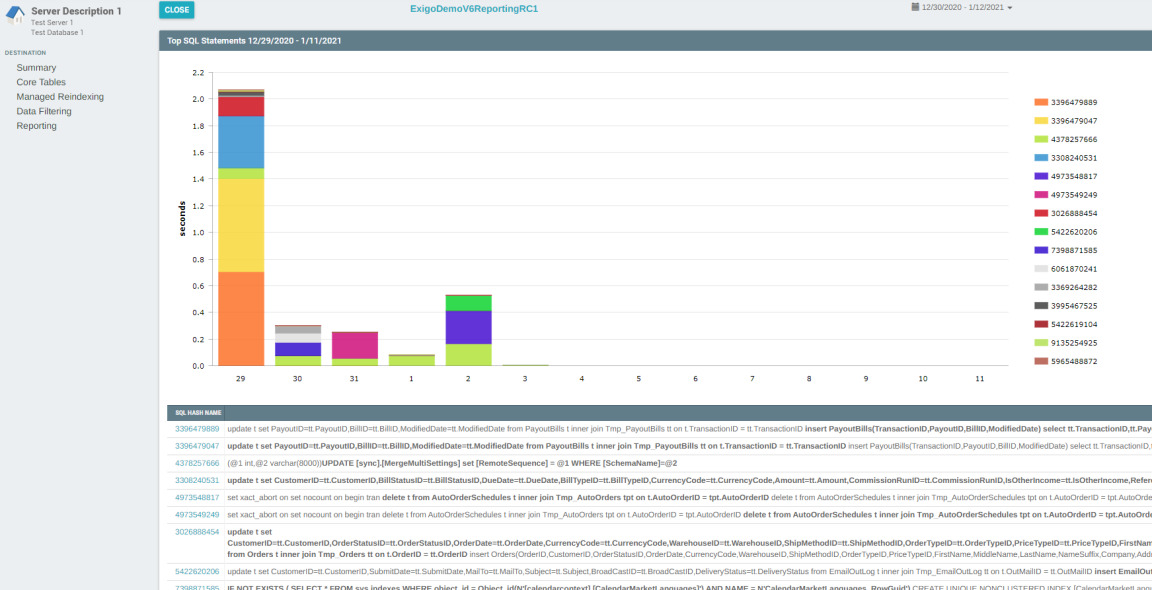
TOP 10SQLSTATEMENTS:
This section provides an overview of the performance details for queries that are being run against your
server.
You can click "Expand" to drill down further on the top 10 queries and their performace metrics using an
interactive chart. Clicking each bar will further drill into time slices, a day, an hour, a 10 minute segment,
etc.


I NDEX F RAGMENTATION :
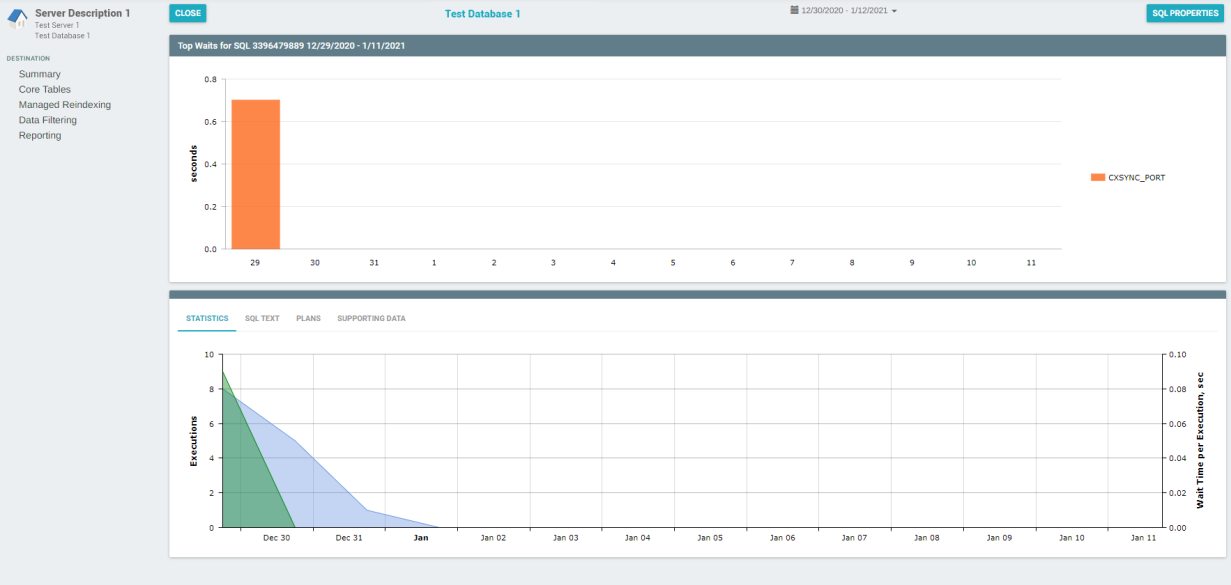
Additionally, you may click on the SQL Hash Name located at the bottom of the page to drill down further
into each of the individual queries and see performance metircs related to each of them. The SQL Text tab
on the bottom will show the actual query statement being run. The Supporting Data tab will show which
Hosts, Users and Applications have been running the query for the time slice. Clicking on the SQL
Properties button at the top right will allow you to name the SQL Statement so you can easily identify it
over time.
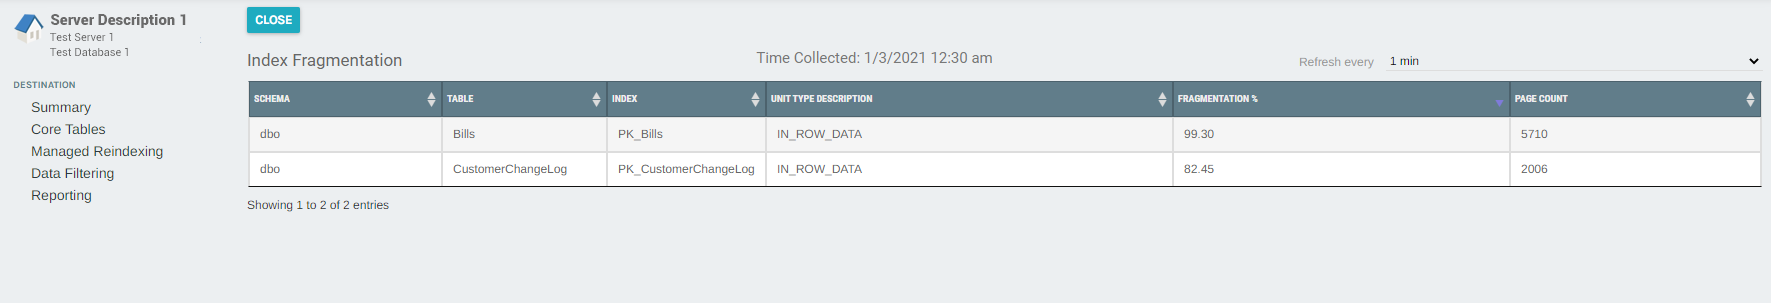
INDEX FRAGMENTATION:
This section provides an overview of details pertaining to table idex fragmentation.
Heavily fragmented indexes can degrade query performance and cause the application accessing it to
respond slowly at times. This tool serves to help identify those instances and aid a user in determining
how they should schedule index rebuilds for a specific table.
You can click "Expand" to drill down further on the top 10 queries and their performace metrics using an
interactive chart.


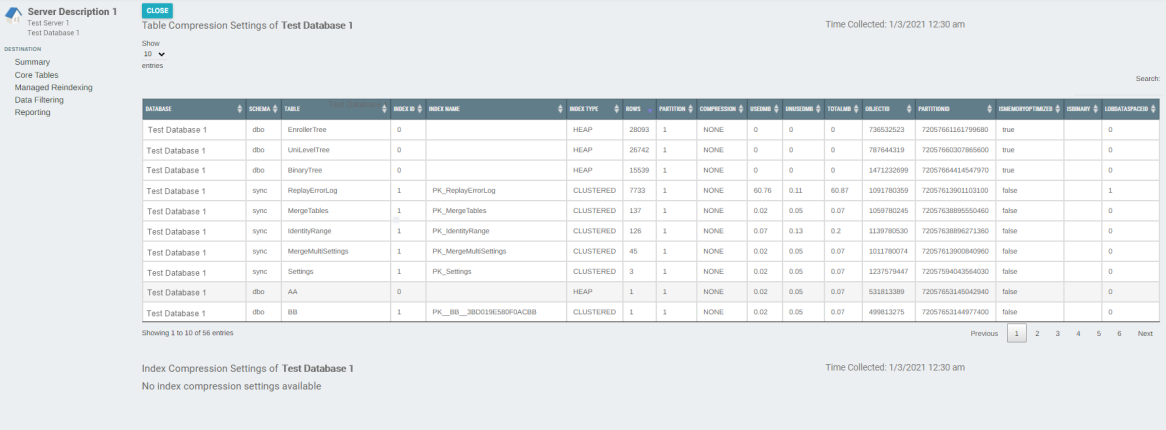
C OMPRESSION S ETTINGS :
COMPRESSION SETTINGS:
This section provideds a on overview of data comperession settings reltated to the tables in your
database.
You can click "Expand" to drill down further on the top 10 queries and their performace metrics using an
interactive chart.
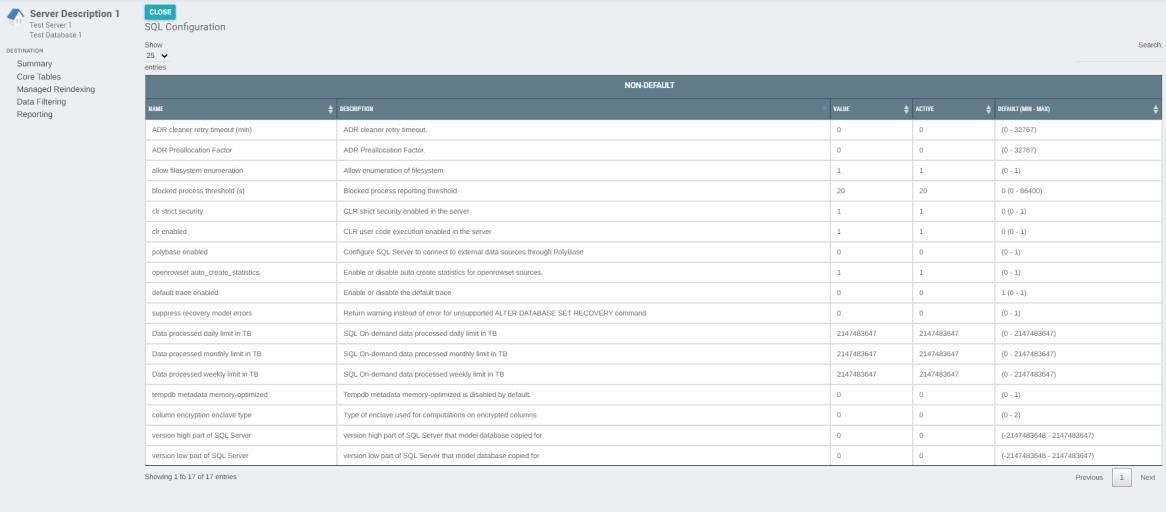
SQLCONFIGURATION:
This section provides an overview of current SQL Configuration settings.
Click "Expand" to see more details as shown below.


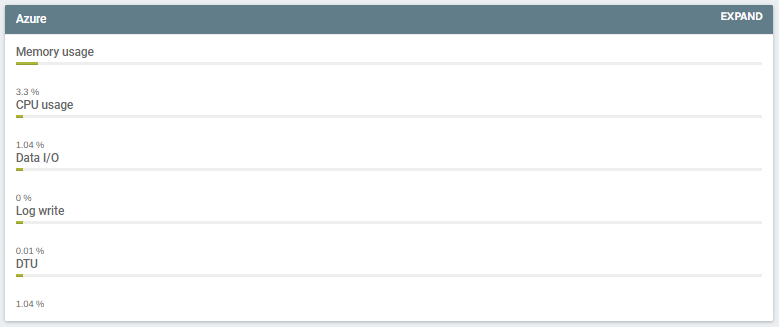
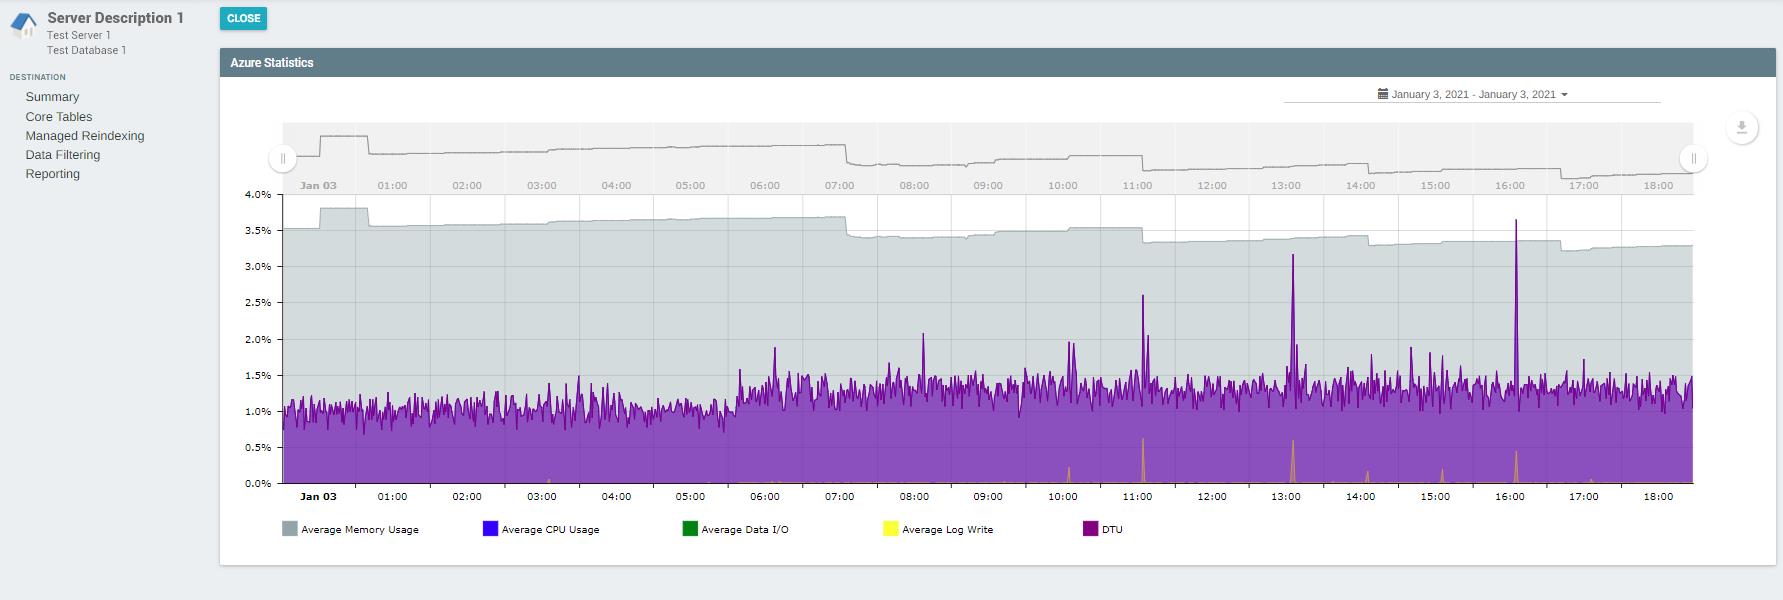
A ZURE :
AZURE:
This section provides a high level overview of your Server Statistics if your reporting database is hosted on
Azure SQL DB (DaaS).
Click "Expand" to see more details and view your data through using an interactive chart as shown below.

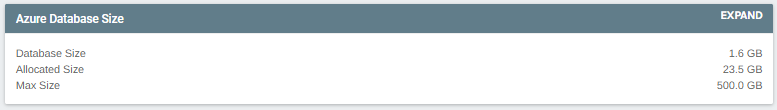
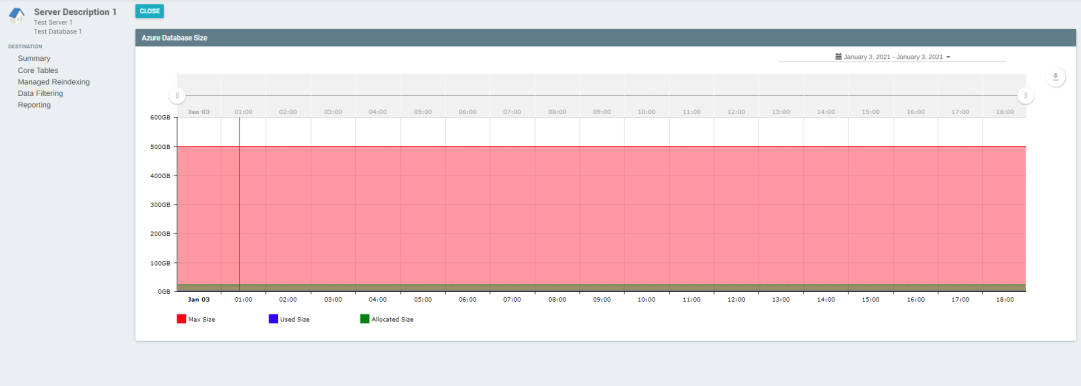
A ZURE D ATABASE S IZE :
AZURE DATABASE SIZE:
This section provides an overview of the details related to the size of your database if your reporting
database is hosted on Azure SQL DB (DaaS).
Click "Expand" to see more details and view your data through using an interactive chart as shown below.
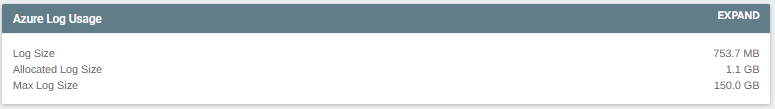
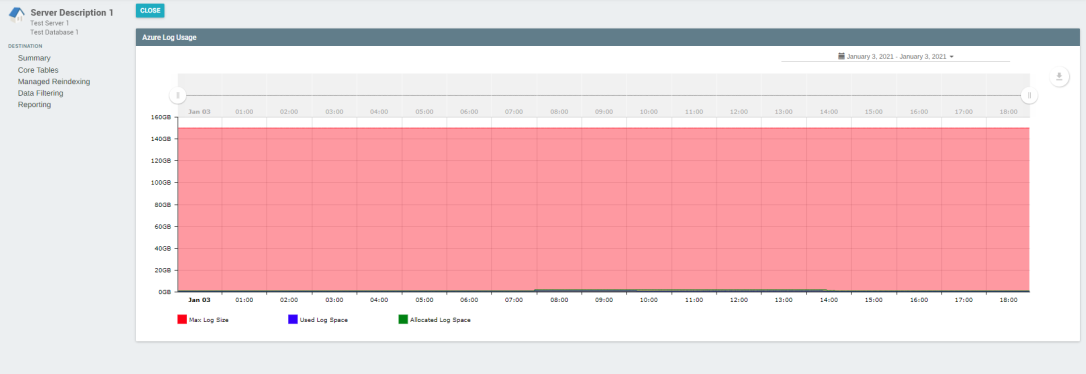
AZURE LOG USAGE:
This section provides an overview of information pertining to your Azure log usage if your reporting
database is hosted on Azure SQL DB (DaaS).
Click "Expand" to see more details and view your data through using an interactive chart as shown below.


M EMORY :
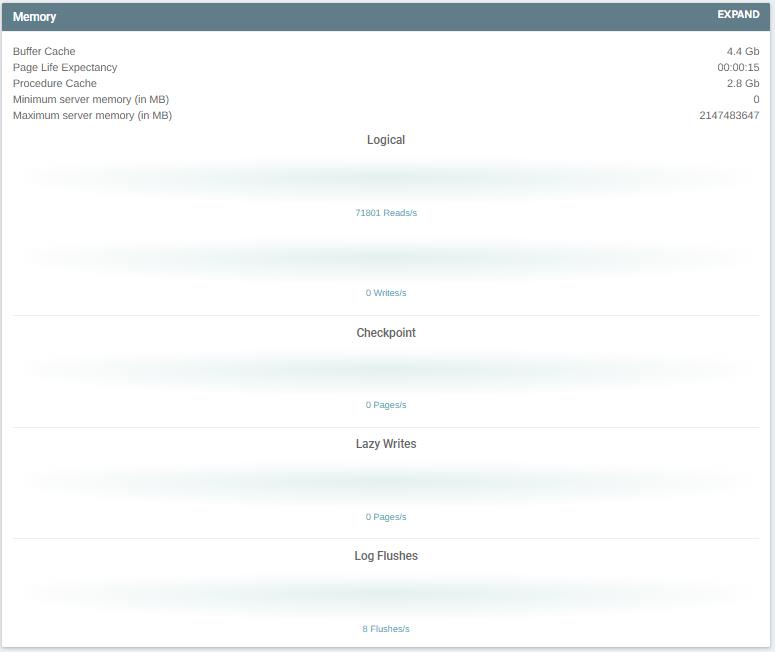
MEMORY:
This section provides an overview of statistics related to the allocated memory for your server
Logical:
- Reads: The flow shows the rate at which pages in the buffer cache are being referenced by SQL
connections (logical page reads).
- Writes: This flow represents data/index pages written to disk.
Checkpoint:
- Pages: This flow represents being written to disk by the Checkpoint Process.
Lazy Writes:
- Pages: This flow represents the number of pages per second that the lazy writer flushing to disk.
Log Flushes:
- Flushes: This flow represents the log pages being written to disk by the Log Writer process.
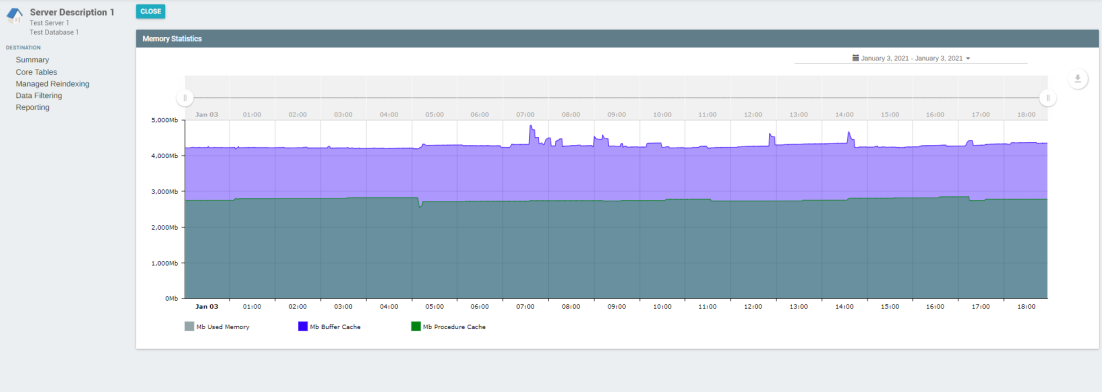
Click "Expand" to see more details and view your data through using an interactive chart as shown below.